| front |1 |2 |3 |4 |5 |6 |7 |8 |9 |10 |11 |12 |13 |14 |15 |16 |17 |18 |19 |20 |21 |22 |23 |24 | 25|26 |27 |28 |29 |30 |31 |32 |33 |34 |35 |36 |37 |38 |39 |40 |41 |42 |43 |44 |45 |46 |47 |48 |49 |50 |51 |52 |53 |54 |55 |56 |57 |58 |59 |60 |61 |62 |63 |64 |65 |review |
 |
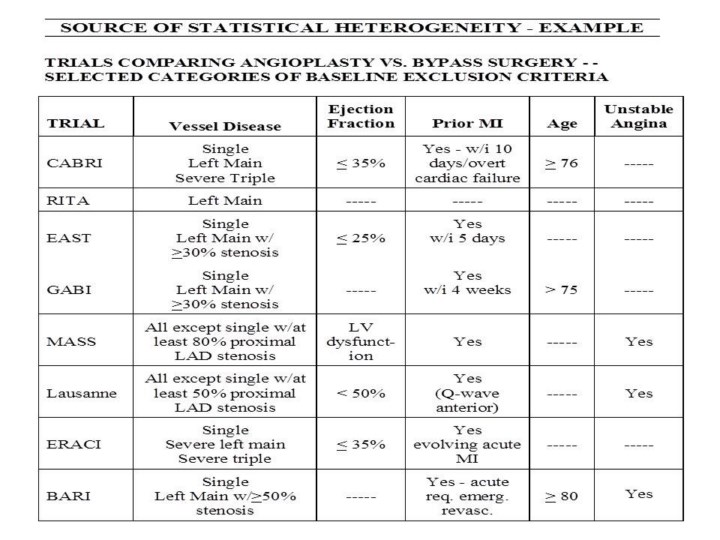
1.This
table represents 8 different trials that compared results of patient
with heart disease treated with either coronary angioplasty or bypass
surgery.
2.The
columns represent different exclusion criteria for enrollment in the
trials, and illustrate substantial variability.
|