| front |1 |2 |3 |4 |5 |6 |7 |8 |9 |10 |11 |12 |13 |14 |15 |16 |17 |18 |19 |20 |21 |22 |23 |24 |25 |26 |27 |28 | 29 |30 |31 |32 |33 |34 |35 |36 |37 |38 |39 |40 |41 |42 |43 |44 |45 |46 |47 |48 |49 |50 |51 |52 |53 |54 |55|56 |57 |58 |59 |60 |61 |62 |63 |64 |65 |review |
 |
1.Here
are the results to review.
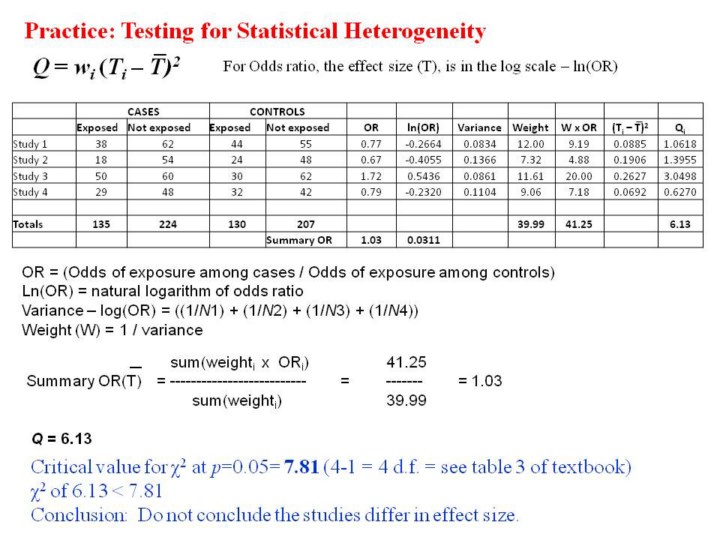
2.As
seen, despite the individual odds ratio appearing to be quite different
(range of 0.67 to 1.72), the Q-statistic of 6.13 does not exceed the
critical value of 7.81.
3.Hence,
this analysis cannot conclude statistical evidence of heterogeneity.
|