 |
 |
front |1 |2 |3 |4 |5 |6 |7 |8 |9 |10 |11 |12 |13 |14 |15 |16 |17 |18 |19 |20 |21 |22 |23 |24 |25 |26 |27 |28 |29 | |
|
Search for most updated materials ↑
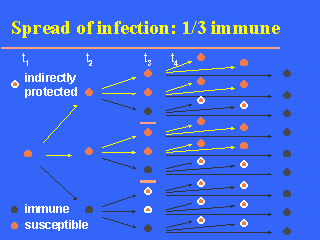
Note that their number and proportion (among all susceptibles) increases as the waves of infectious transmission progress. MORE: Number of contacts, immunes and susceptibles in successive time periods of transmission.
|
 This
slide shows those who are indirectly protected from infection in our imaginary
example.