 |
 |
front |1 |2 |3 |4 |5 |6 |7 |8 |9 |10 |11 |12 |13 |14 |15 |16 |17 |18 |19 |20 |21 |22 |23 |24 |25 |26 |27 |28 |29 | |
|
Search for most updated materials ↑
The problem is that R0 cannot be directly
measured, as it does not represent a real event. We therefore have to calculate it through
some other (measurable) quantity. This is where the average age at infection comes in. The average age at infection reflects many of the basic biological and social elements
reflected in R0.
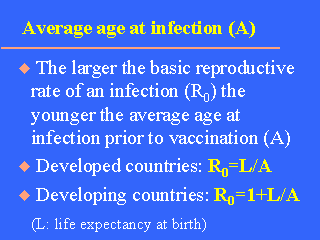
It can be intuitively understood that the larger the
basic reproductive rate of an infection (R0) (remember its definition in slide
10) the faster it will spread in society and, therefore, the younger the average age at
infection prior to the introduction of vaccination (A). It has been demonstrated that, under certain assumptions, the basic reproductive rate
(R0) relates in a simple way to the average age at infection prior to the
introduction of vaccination (A) and to the life expectancy of the population (L). It is approximately: R0=L/A, (developed countries), R0=1+L/A, (developing countries). Different formulae are used for developed and developing countries because of the
different age structure of the two types of population.
|
