 |
 |
front |1 |2 |3 |4 |5 |6 |7 |8 |9 |10 |11 |12 |13 |14 |15 |16 |17 |18 |19 |20 |21 |22 |23 |24 |25 |26 |27 |28 |29 | |
|
Search for most updated materials ↑
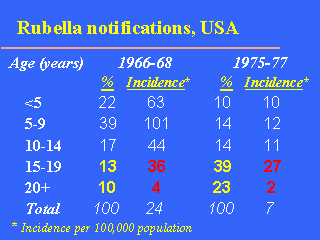
It illustrates the expected increase in age at infection:
in 1975-77, a larger proportion of cases were 15+ years (yellow numbers). Despite
this, the age-specific incidence
in persons aged 15+ years was lower in 1975-77
(red numbers) along with the total
incidence which was also lower
(bottom
line). This was a favourable outcome of immunisation: the (inevitable)
relative increase of
rubella occurrence in older age-groups was accompanied by an
absolute decrease. (Source of data: Preblud SR, Serdula MK, Frank JA, Brandling-Bennett AD, Hinman AR.
Rubella vaccination in the United States: a ten-year review.
Epidemiol Rev 1980;
2:171-94.)
|
