| front |1 |2 |3 |4 |5 |6 |7 |8 |9 |10 |11 |12 |13 |14 |15 |16 |17 |18 |19 |20 |21 |22 |23 |24 |25 |26 |27 |28 |29 |30 |31 |32 |33 |34 |35 |36 |37 |38 |39 |40 |review |
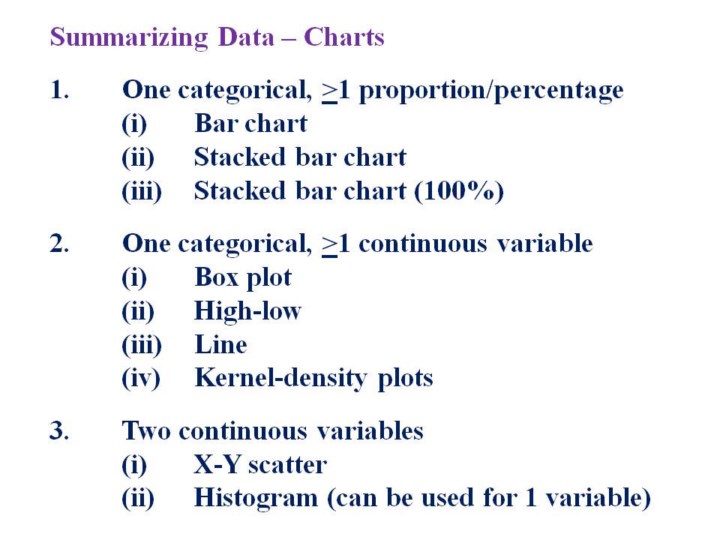 |
1.Here
are the types of charts we will look at.
2.As
you can see, the best way to present data is determined by numerical
properties of the 2 variables of interest, such as continuous versus
categorical.
|