| front |1 |2 |3 |4 |5 |6 |7 |8 |9 |10 |11 |12 |13 |14 |15 |16 |17 |18 |19 |20 |21 |22 |23 |24 |25 |26 |27 |28 |29 |30 |31 |32 |33 |34 |35 |36 |37 |38 |39 |40 |review |
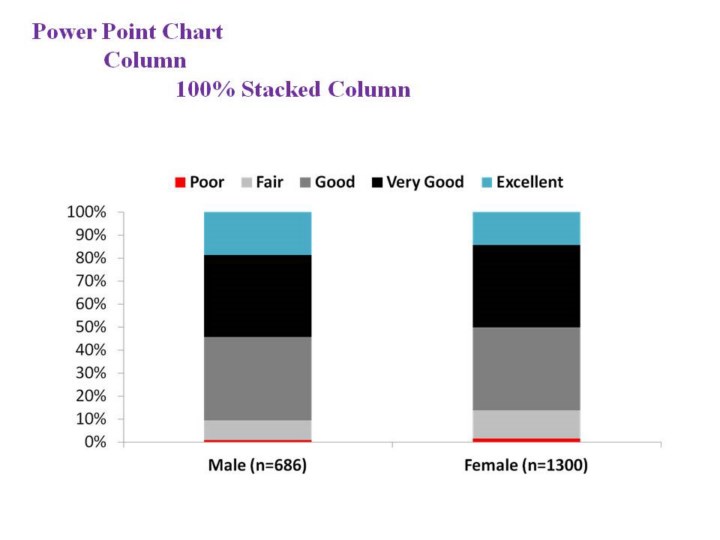 |
1.Here
is the completed example in Power Point.
2.The
figure drawn in your handout should look close to this.
3.In
this example, males appear to report overall better quality of life than
females.
|