| front |1 |2 |3 |4 |5 |6 |7 |8 |9 |10 |11 |12 |13 |14 |15 |16 |17 |18 |19 |20 |21 |22 |23 |24 |25 |26 |27 |28 |29 |30 |31 |32 |33 |34 |35 |36 |37 |38 |39 |40 |review |
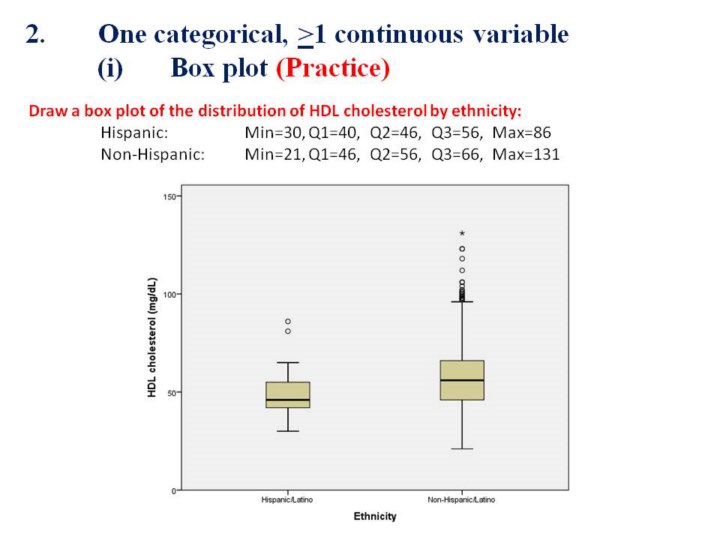 |
1.The
figure your drew should like similar to this figure which was generated
by use of SPSS.
2.In
this example, the range of HDL cholesterol levels (i.e. from low to
high) is greater for Non-Hispanics compared to Hispanics.
|