| front |1 |2 |3 |4 |5 |6 |7 |8 |9 |10 |11 |12 |13 |14 |15 |16 |17 |18 |19 |20 |21 |22 |23 |24 |25 |26 |27 |28 |29 |30 |31 |32 |33 |34 |35 |36 |37 |38 |39 |40 |review |
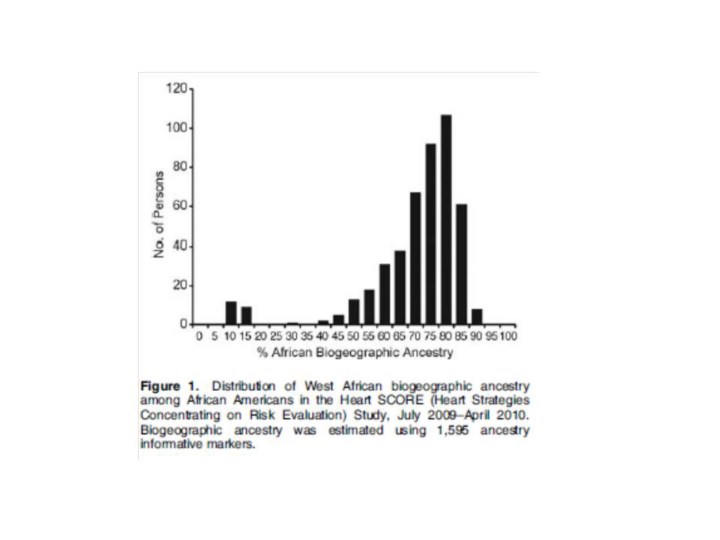 |
1.In
the Heart SCORE study conducted in the greater Pittsburgh area, the
slide represents the “admixture” scores among participants who
self-reported their race as African American.
2.As
seen, most of these participants have ancestral markers consistent with
African ancestry.
3.However,
you will note that there are several individuals (e.g. the 10% and 15%
ancestry values) whose genetic makeup appears to indicate other
ancestry, such as European descent.
|