| front |1 |2 |3 |4 |5 |6 |7 |8 |9 |10 |11 |12 |13 |14 |15 |16 |17 |18 |19 |20 |21 |22 |23 |24 |25 |26 |27 |28 |29 |30 |31 |32 |33 |34 |35 |36 |37 |38 |39 |40 |review |
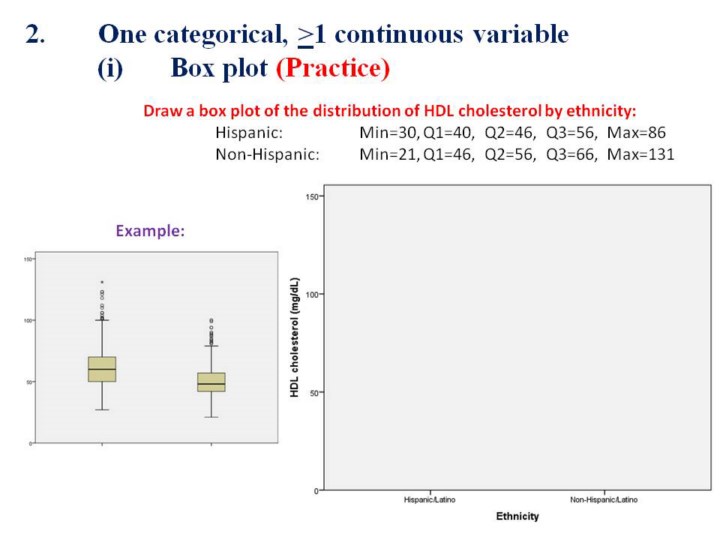 |
1.For
this practice exercise, use this template from your handout and the
results on this slide to hand draw the distribution of HDL cholesterol
levels by ethnicity.
2.Use
the figure labeled “Example” to help you draw the distribution.
|