| front |1 |2 |3 |4 |5 |6 |7 |8 |9 |10 |11 |12 |13 |14 |15 |16 |17 |18 |19 |20 |21 |22 |23 |24 |25 |26 |27 |28 |29 |30 |31 |32 |33 |34 |35 |36 |37 |38 |39 |40 |review |
 |
1.In
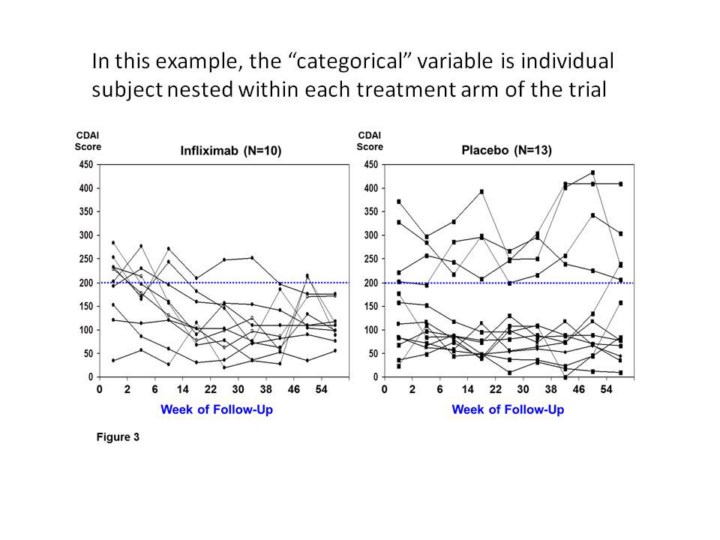
this very detailed example of a line chart, 2 treatment groups are
presented separately.
2.Each
patient’s Crohn’s Disease Activity Index (CDAI) score is presented over
time.
3.As
seen, patients taking Infliximab tended to have less disease activity
over time, whereas no such effect was seen among patients in the placebo
group.
|