| front |1 |2 |3 |4 |5 |6 |7 |8 |9 |10 |11 |12 |13 |14 |15 |16 |17 |18 |19 |20 |21 |22 |23 |24 |25 |26 |27 |28 |29 |30 |31 |32 |33 |34 |35 |36 |37 |38 |39 |40 |review |
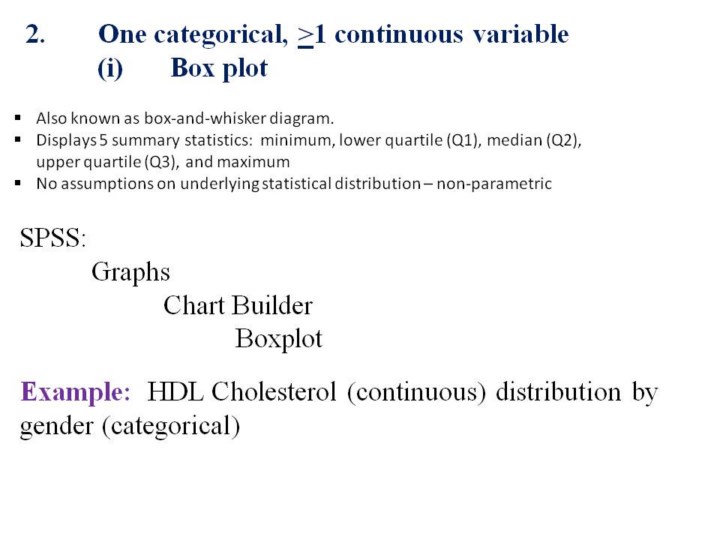 |
1.Let’s
use SPSS to create a box plot.
2.In
this example, we want to show the distribution of HDL cholesterol (the
“good” cholesterol) by gender.
3.The
SPSS syntax is listed on this slide with how to interpret the summary
statistics.
4.Programming
note: will need to leave Power Point and open SPSS to run this
procedure.
|