| front |1 |2 |3 |4 |5 |6 |7 |8 |9 |10 |11 |12 |13 |14 |15 |16 |17 |18 |19 |20 |21 |22 |23 |24 |25 |26 |27 |28 |29 |30 |31 |32 |33 |34 |35 |36 |37 |38 |39 |40 |review |
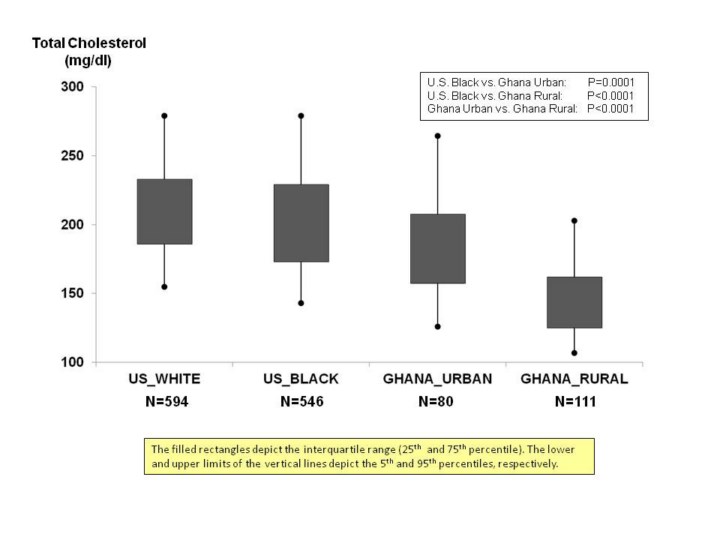 |
1.Here
is another example of use of the “high-low” graph.
2.Note
how total cholesterol levels differ between urban and rural Ghanaians,
and that urban Ghanaians seem to be closer to U.S. Whites and Blacks
than rural Ghanaians.
3.This
is a strong indication of “Westernization” influencing (adversely)
biological parameters.
|