| front |1 |2 |3 |4 |5 |6 |7 |8 |9 |10 |11 |12 |13 |14 |15 |16 |17 |18 |19 |20 |21 |22 |23 |24 |25 |26 |27 |28 |29 |30 |31 |32 |33 |34 |35 |36 |37 |38 |39 |40 |review |
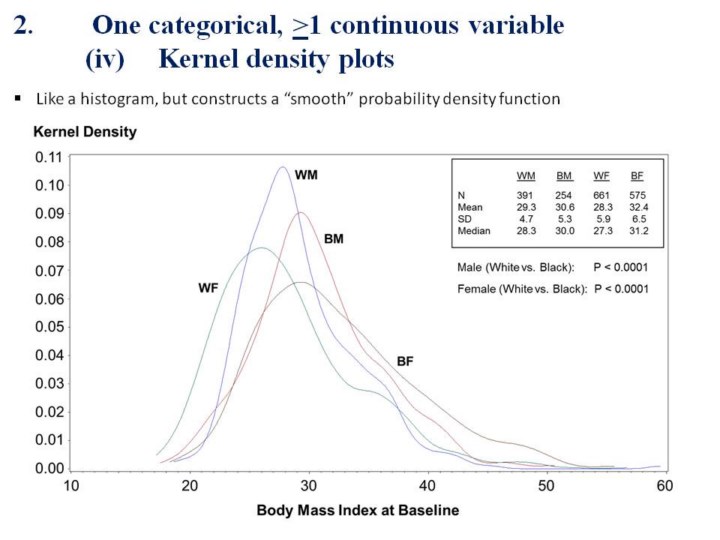 |
1.This
graph is known as a “kernel” density plot.
2.It
is similar to a histogram, but smooths all values of the distribution
according to a probability density function.
3.In
this example, you can see that white females tends to have lower body
mass index values, and black females tends to have the highest body mass
index values.
|