| front |1 |2 |3 |4 |5 |6 |7 |8 |9 |10 |11 |12 |13 |14 |15 |16 |17 |18 |19 |20 |21 |22 |23 |24 |25 |26 |27 |28 |29 |30 |31 |32 |33 |34 |35 |36 |37 |38 |39 |40 |review |
 |
1.The
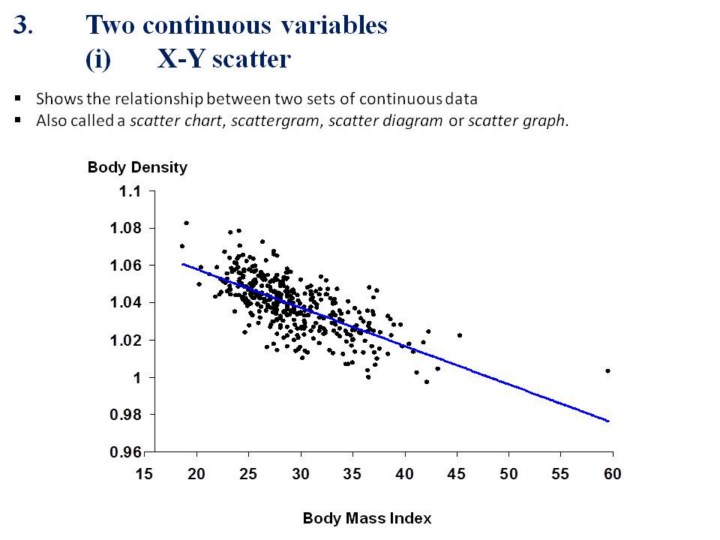
scatter plot is a very common graph that is used to present the
relationship between 2 continuous variables.
2.As
seen in this slide, there is a strong relationship between measures of
body density and body mass index.
3.In
other words, as bod density tends to go down, body mass index goes up.
This is known as a “negative” or “inverse” association.
|